Adaptyst sprint #3: summary

The third Adaptyst sprint at CERN took place between 18 June 2026 and 1 July 2026. Its length was much closer to intended 2 weeks this time: it was extended only by ~12 hours on 1 July (from the noon until approximately the end of the day) to account for teleworking of the Adaptyst main R&D person and his related greater flexibility then.
The following public issues were scheduled to be performed (the order here may not reflect the actual one):
- Add Adaptyst Analyser API:
- Add code regionisation support to linuxperf
- Move from patched “perf” to in-house equivalent
Furthermore, 2 CERN-internal issues were scheduled, not available to be viewed publicly. These were / will be discussed separately using private channels if needed.
Document the existing REST API and document the Python API (subtasks of “Add Adaptyst Analyser API”)
As suggested by the previous article, a demo meeting had to be held with the LHCb experiment at CERN before any work could be done here. This took place on Friday 26 June with one of the LHCb computing people. Valuable insights and feedback were gathered there, which will inform the next steps for the Adaptyst Analyser API and Adaptyst in general.
Following the meeting, the API documentation will be worked on in the next sprint (#4). Once this is done along with the linuxperf code regionisation documentation (see below), new development releases will be published. The API changes include also a possibility of sharing results or their parts easily via URLs with others running the same Adaptyst Analyser instance.
If you want to check out the Adaptyst Analyser API and related changes now, see the “api” branch of the Adaptyst Analyser repository and the repositories of Adaptyst-team-made modules (the list on GitHub). Beware that git force-pushes may happen there! You may want to wait until the documentation is ready though.
Add code regionisation support to linuxperf
This task was successfully completed: linuxperf supports the code regionisation feature of Adaptyst now. It works in the following way:
- A user annotates their code with regions they want to specifically analyse / highlight. This is module-independent, see the documentation linked above for more details.
- When a code region is running, on-CPU and off-CPU samples sent by “perf” to the linuxperf module are placed in a separate space dedicated to the region. This happens on the linuxperf side and not in “perf”.
By default, region-specific data are saved in addition to overall performance analysis, but ifregions_onlyis set to true in the module options, everything sent by “perf” outside of specified code regions is discarded except for basic thread/process metadata. Furthermore, to avoid metric overestimation, only second and next occurrences of non-off-CPU samples are processed inside a region: this can be changed by setting theregion_save_on_firstmodule option to true. - After Adaptyst finishes executing and Adaptyst Analyser opens the results, code regions are treated very similarly to threads/processes: they are displayed separately under their thread/process entries in the timeline view as shown in figures 1 and 2 and analysis data dedicated to these can be inspected, e.g. flame graphs.
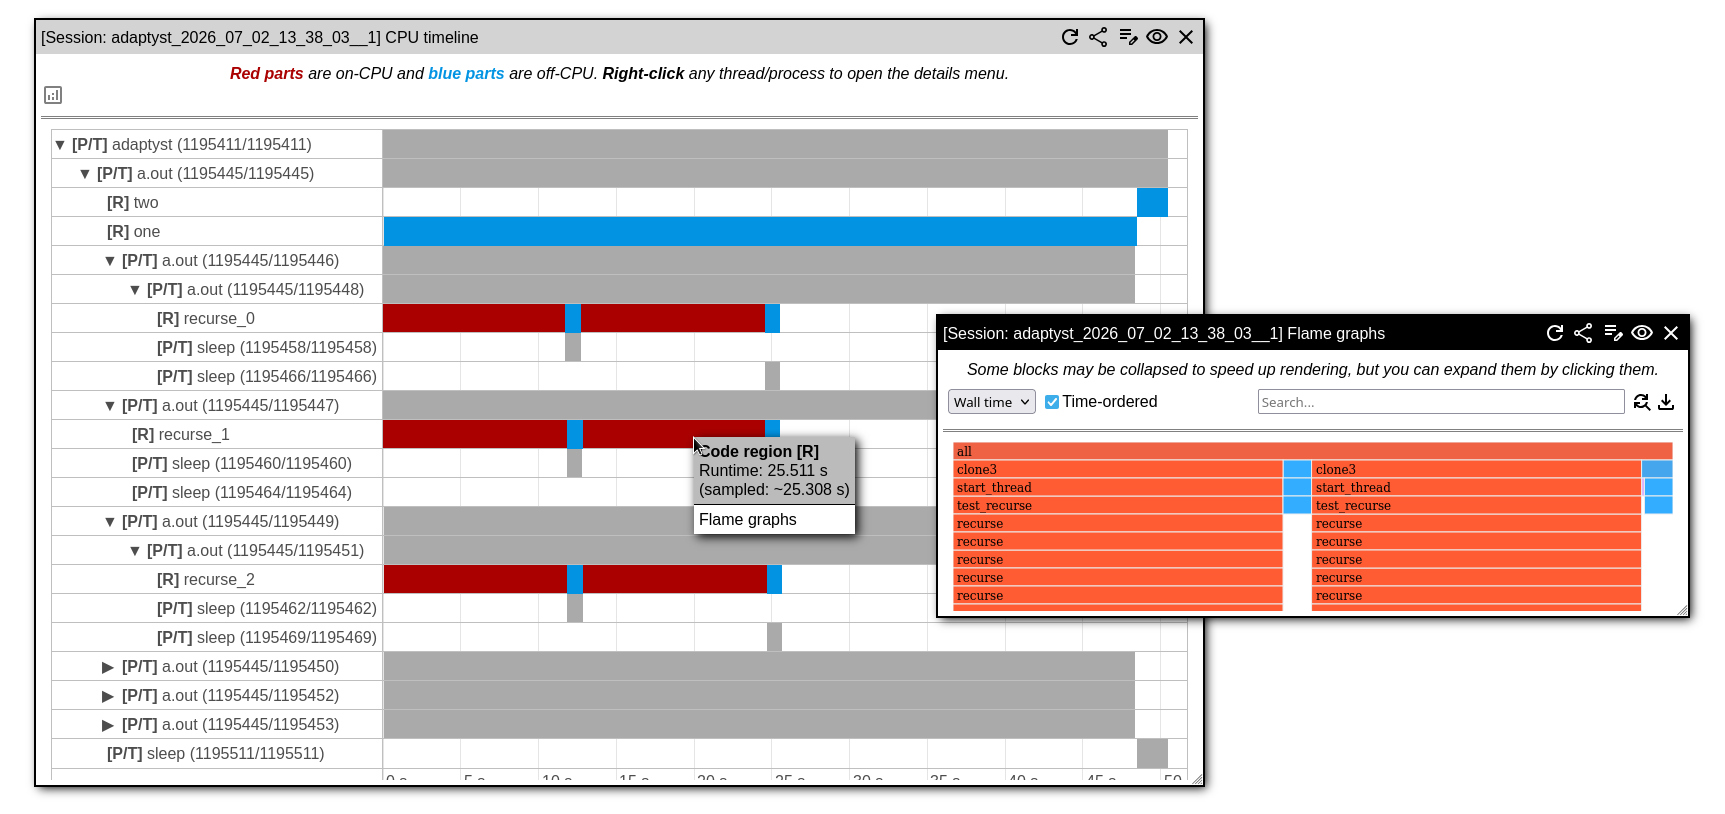
regions_only was set to true here, most non-region-related information was discarded, hence the grey blocks for threads/processes. [R] indicates “code region” and [P/T] indicates “process/thread”. The flame graph opened next to the timeline is for the recurse_1 region.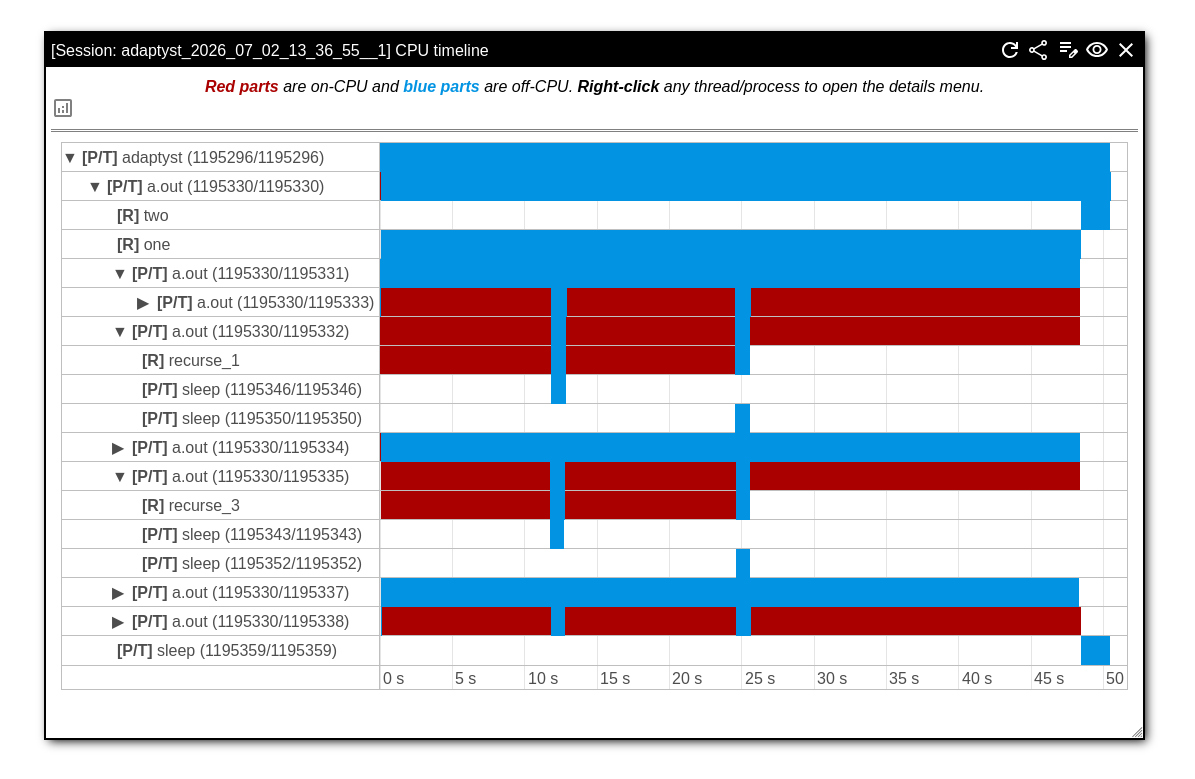
regions_only set to false (which is the default).Because the “perf”-to-in-house switch is about to begin very soon, implementing code regionisation in a more advanced way didn’t make sense in this sprint. When the patched-“perf” arrangement is retired in linuxperf, the regionisation support will/may be extended depending on your feedback.
The documentation is still yet to be written (scheduled for the next sprint #4): when this is done, new development releases will be published. However, if you want to try code regionisation for CPU performance analysis already now, see the “regions” branch of the linuxperf module repositories (the list on GitHub). As before, beware that git force-pushes may happen there + you may also want to wait until the documentation is ready.
Move from patched “perf” to in-house equivalent
Unfortunately, no work on this was performed during this sprint. The task was rescheduled for the next sprint (#4) and its state is likely to change to “In progress” then. However, due to the predicted complexity, the work may be still unfinished when sprint #4 ends.
Next sprint
Adaptyst sprint #4 already started on 2 July 2026: it can be followed in the issue tracker and in the forum.
Because the Adaptyst main R&D person is on vacation in the week of 13 July, the planned length of the sprint is exceptionally ~3 weeks rather than 2 weeks (the intended end date is 24 July at 5:30 pm CERN time). For the same reason, the next blog post will be published in the week of 20 or 27 July.